

Virginia Middle School Creates Custom Analysis Platform for VDOE Growth Assessments

(any names or information contained in screenshots in this post are fictitious and created solely for the purpose of this article)
Beginning with the 2021-2022 school year, students in Virginia public schools will take growth assessments in grades 3-8 reading and mathematics. Individual student score reports will be provided with details of how students performed on each test item, but the growth assessments do not include a passing/failing score.
The focus on these assessments is on identifying what students have already learned as well as the skills they may need additional help with during this school year.

Since this data is going to be used to help teachers understand what areas they need to focus on with their students for future success, it is important they have the data broken into useable pieces teachers can quickly and easily read.
While the results are returned as student-by-student data, it’s necessary for teachers to be able to see the larger picture. The only other option we are given is to export a spreadsheet of data that teachers would need to sift through, sort, or create PivotTables on to be able to better analyze the data on a larger scale.
The problem with this approach is that it requires time on behalf of every teacher, time most do not have. PivotTables also require time and effort to create properly, especially when you’re not used to using them regularly.
So, our solution was to create a system that could take the entire export file and complete the analysis on the full dataset.
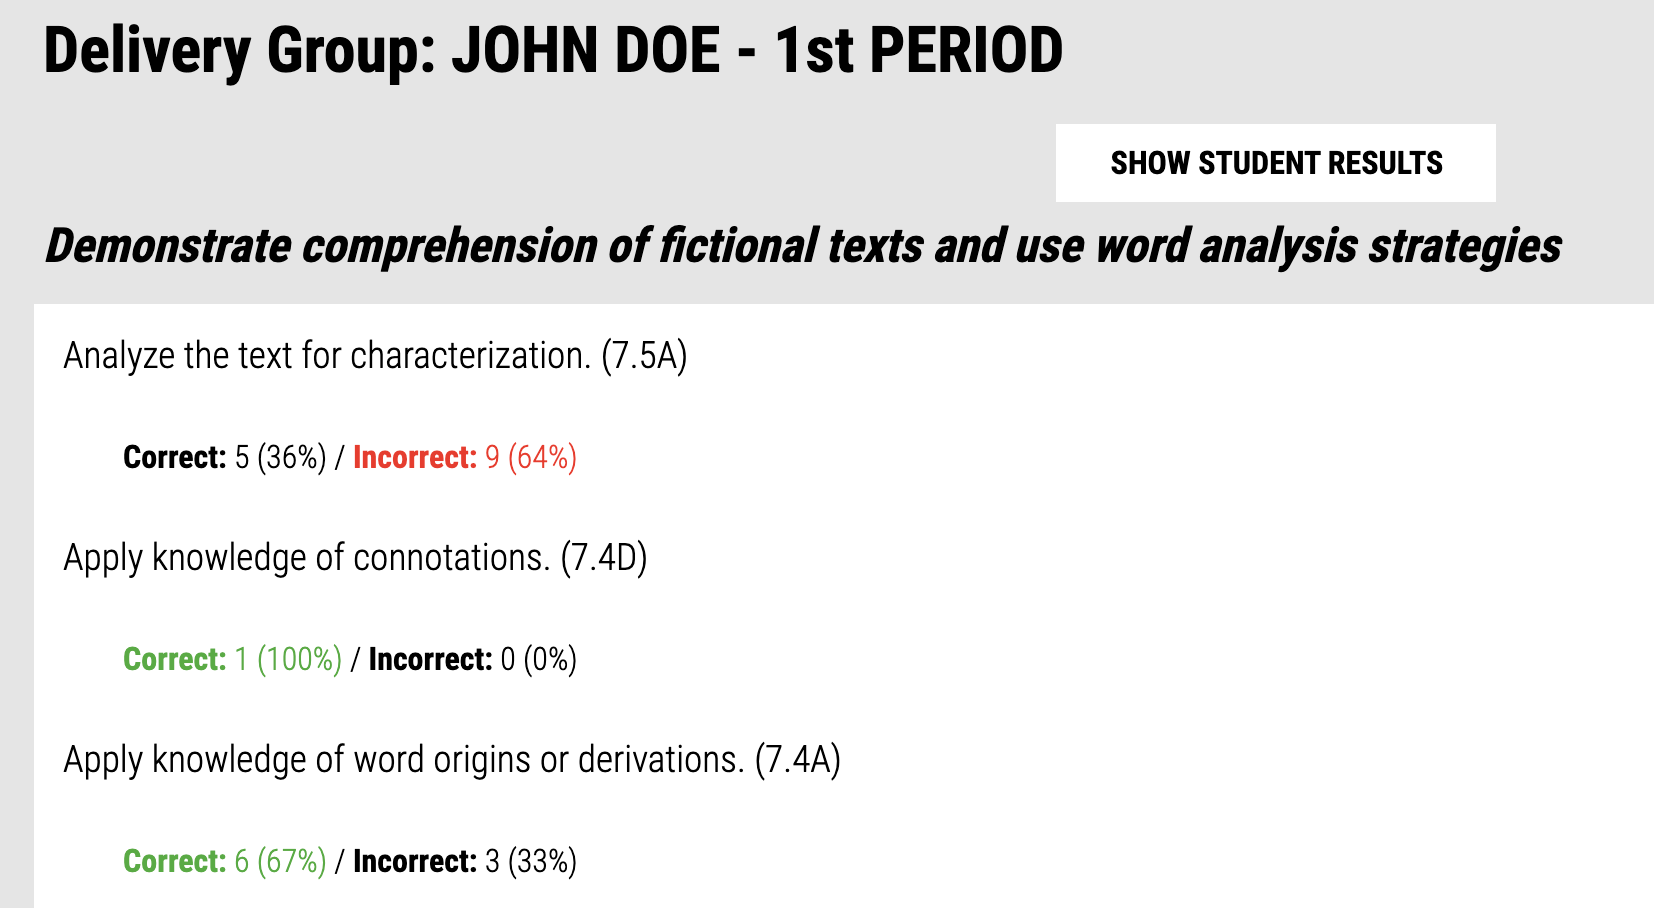
By doing this, teachers can now see each class (also known as “Delivery Groups”) they administered the growth analysis to, as well as the category the question fell into, the strand (otherwise known as the SOL standard the question was based on), and the percentage of questions students answered correct or incorrect for that particular strand.
If desired, there is also the ability to toggle on student names, so they can see how each students did on that question. And, teachers can also view the question difficulty (low, medium, and hard) that was given to the student for that particular strand.

While this may seem like a trivial project, having the ability to feed in a large set of data and having the results for all teachers and delivery groups immediately was of a huge importance. Time savings, if nothing else, is always a plus in the world of education.
Beyond that, having detailed breakdowns of what each class needs to focus on to perform better in the future, is a huge help to our teachers and to our school.